This map illustrates the increase in temperature from 1880 to 2100, highlighting the significant warming trends observed over this period.
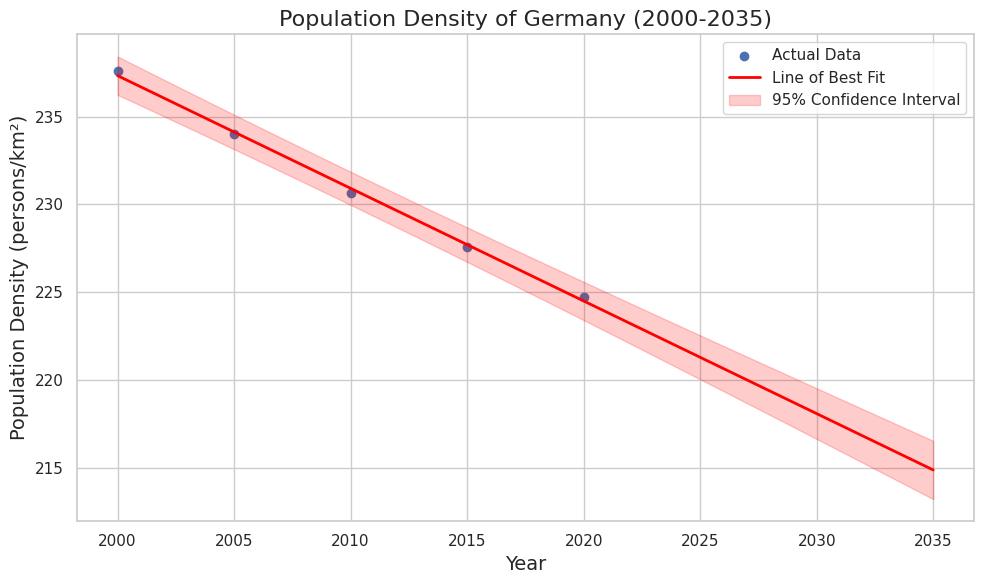
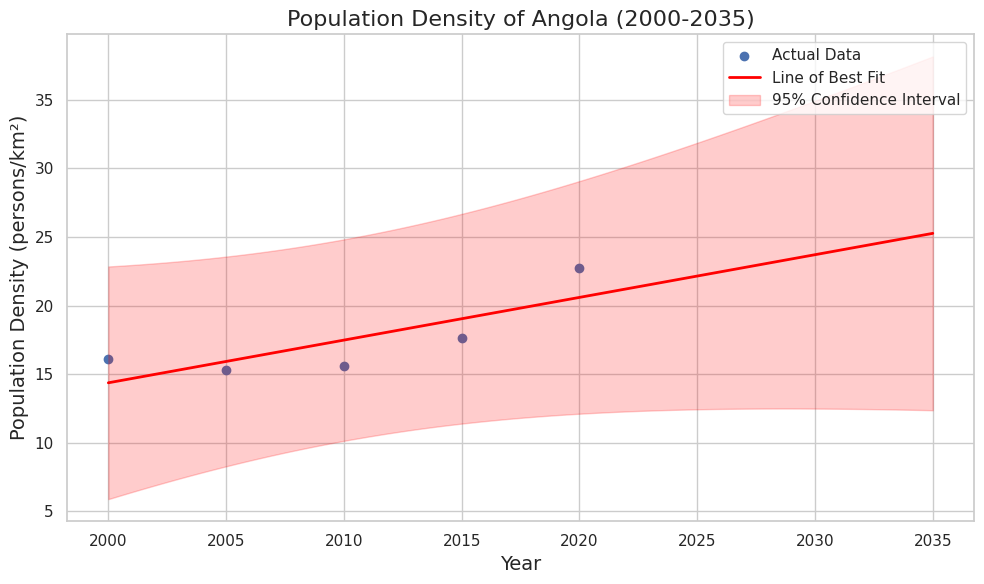
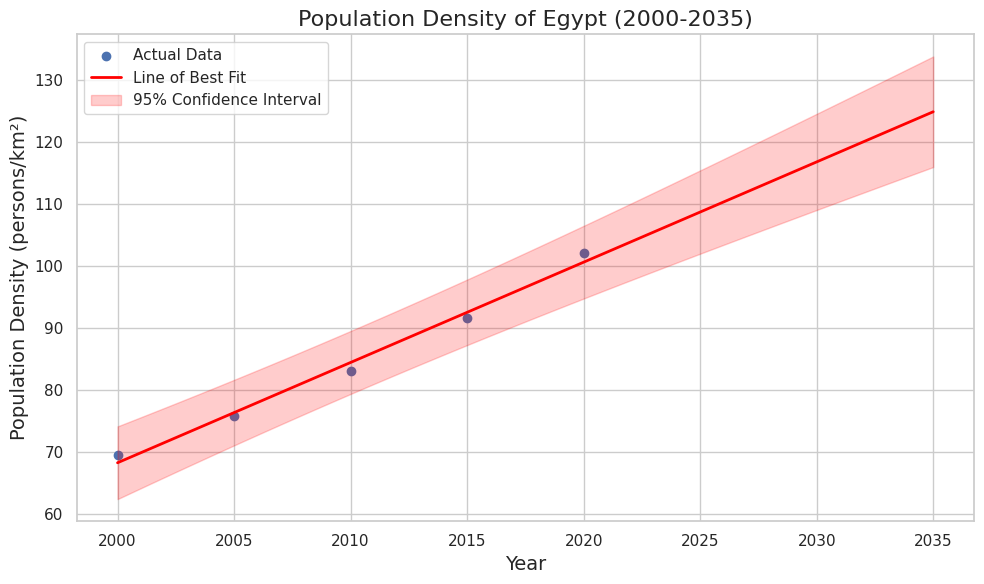
The following graphs forecast the population density of three countries up to 2035 based on current data of
the GHC Socioeconomic population density dataset.
Continuity Plan:
Based on air-sea CO₂ flux dataset on US GHG center reported monthly from 2020 to 2022, we applied CNN-LSTM model to forecast maps of how Ocean CO2 Flux for next years. However, due to dataset size limitations, as there are only 36 months reported, the model loss was really high. Now, we tried to enhance the model by initializing its weights to saved weights of the same model but trained on another larger dataset. This enhances the Structural Similarity Index (SSIM) metric, which indicates perfect similarity between the predicted and actual images, but the overall loss is still high.
This prediction is far from actual map, however, we’re working on enhancing this by searching for other similar datasets about CO2 ocean flux. Another challenge is the limitation of the computational resources that prevents us from increasing the model complexity for better predictions.
Nevertheless, our team, terratales, will keep enhancing the work till reach satisfactory results.
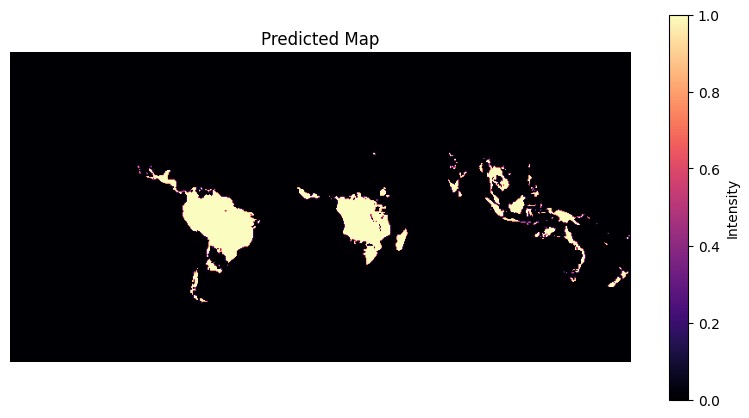
An image predicted by the model